Standard Index Overlay Strategy
Questions
Questions:
- Standard commodities indices, which are based on fixed allocations to a basket of commodities, are popular and easily tradeable.
- Can we produce an overlay strategy for the standard indices?
Approach:
- The AiLA strategies are typically based on allocation decisions associated with individual assets, such as the March Corn or December WTI contracts.
- The individual asset allocations are aggregated to form a commodity level allocation.
- The commodity allocations are combined according to the standard index weights to obtain the overlay strategy allocations for the standard index as a whole.
Aggregation at Commodity Level
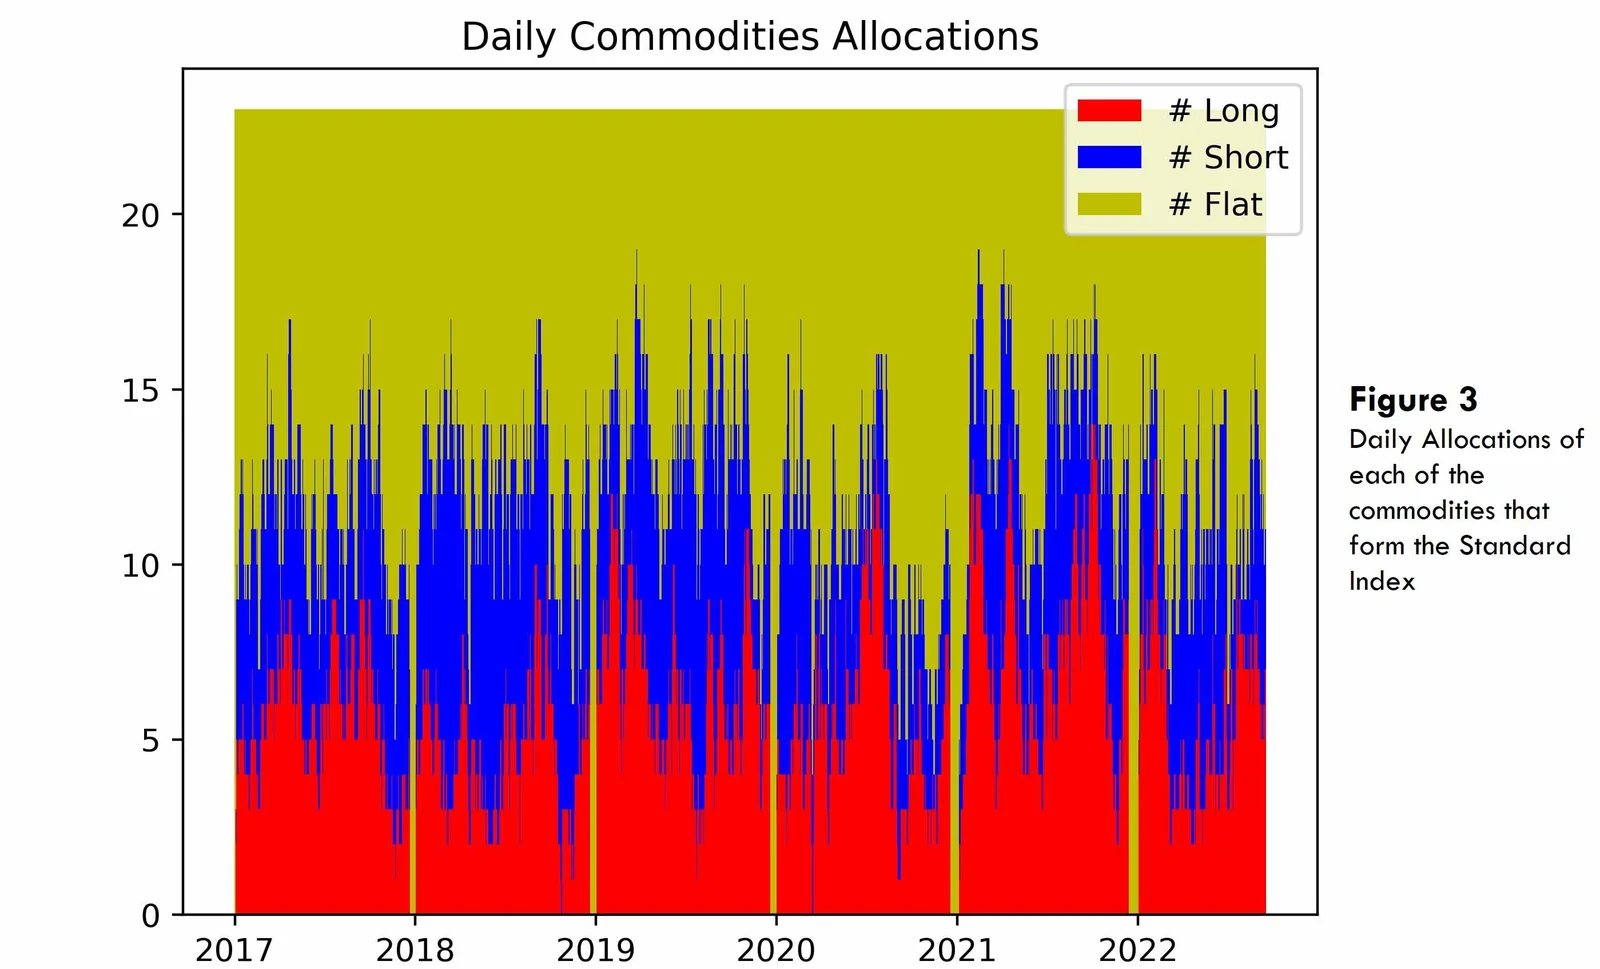
- All the individual assets like March Corn, May Corn etc. are considered for all the commodities that form the standard commodity index.
- The AiLA models generate the allocation decisions for all the individual assets.
- Based on a recent study on the structures of the individual asset allocations[1], a balanced set of individual assets are used as they provide hedging benefits and therefore better risk adjusted performance.
- The allocation decisions of these individual balanced assets are combined at the commodity level based on the majority vote.
- The individual commodity weights used by the standard index are further used to calculate the overlay strategy allocations.
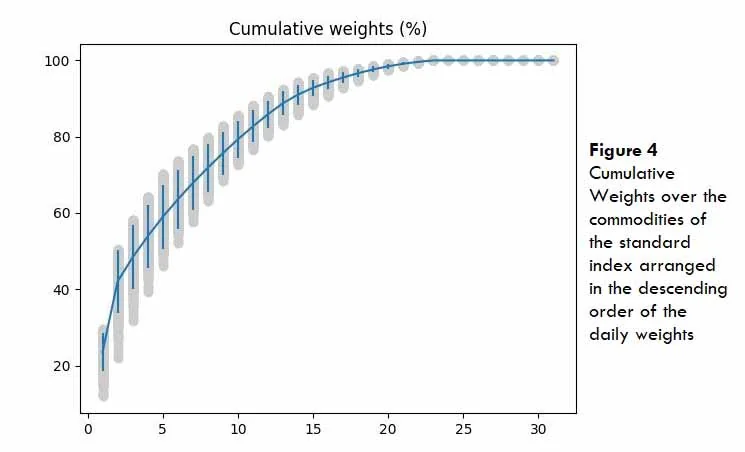
- Figure 4 shows that the top 5 commodities in terms of their daily weights, which belong to the Oil and Gas sector, are given an average weight of 60% in the standard index calculation.
[1] Hedging Benefits from Individual Assets - https://aila-x.com/perspectives/hedging-benefits-from-individual-assets
Overlay Strategy Allocation
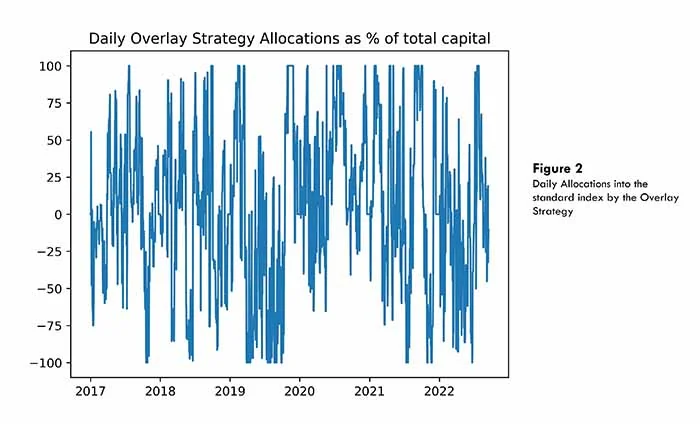
- The overlay strategy allocations is obtained by taking the weighted average of the daily commodities allocations based on the weights of these commodities in the standard index.
- The obtained overlay strategy allocations are winsorized at ±2SD, where SD is the running standard deviation of the allocations, and then normalized to ±100% (shown in Figure 2).
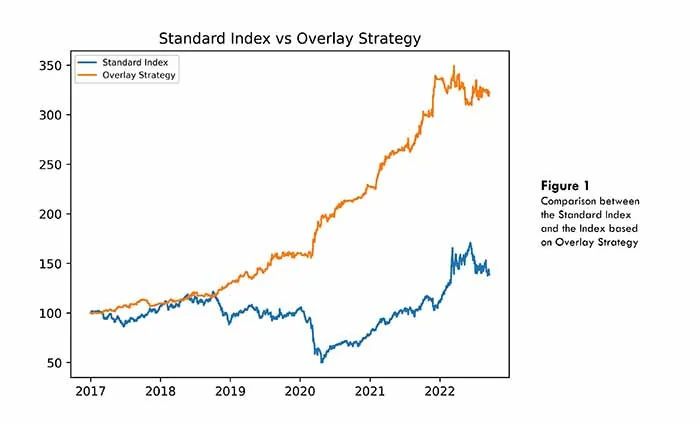
- Based on the risk-adjusted performances compared in Figure 5, the overlay strategy on the standard index performs significantly better than the standard index alone with the Sharpe Ratios
𝑆𝑅 (𝑆𝑡𝑎𝑛𝑑𝑎𝑟𝑑 𝐼𝑛𝑑𝑒𝑥) = 0.36
𝑆𝑅 (𝑂𝑣𝑒𝑟𝑙𝑎𝑦 𝑆𝑡𝑟𝑎𝑡𝑒𝑔𝑦) = 1.94
- As Oil and Gas sectors are allocated 60% in the standard commodity index, the performance of the overlay strategy is also shown when based only on the Oil and Gas commodities allocations, as well as when excluding them.
- The ability to take long and short positions in the standard index helps the overlay strategy with obtaining the better performance than the long-only position in the standard index.
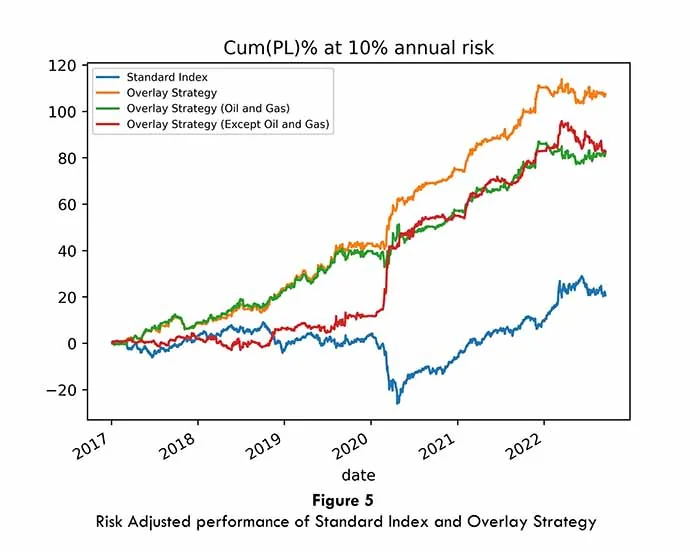
- The above PL chart of the overlay strategy for Non Oil and Gas Sectors indicates that during the dips, the allocations turn negative suggesting a short position in the standard index which helps the overlay strategy performance.
- Whereas, the overlay strategy on the Oil and Gas Sectors has been consistently performing and contributes to the stable performance of the entire overlay strategy.
Conclusions
- The individual asset allocation decisions for a balanced set of assets are aggregated based on majority vote to obtain the commodity level allocation decisions.
- The commodity level allocation decisions are weighted according to the standard index weights to obtain the overlay strategy allocation.
- The risk adjusted overlay strategy performance appears significantly better than the long-only standard index performance and the historical performance can be attributed to the following factors.
- The individual AiLA allocation models that run at the ground level extracting the optimal performance out of any asset.
- The balanced asset selection process which results in the low correlation between the individual asset allocation and thus provides hedging benefit and better risk adjusted performance.
- The ability to identify the market regimes and to appropriately take both long and short positions on the standard index.