
Spread Strategies
Introduction
Introduction
- AiLA strategies often comprises outright futures assets with opportunistic allocations targeting certain risk/reward objectives.
- AiLA strategies can, however, also accommodate futures spreads, where the spreads are treated as an asset following some common definitions.
- Note: the examples and results here only address intra-commodity spreads, where other types will be discussed in future decks.
Spread Definition
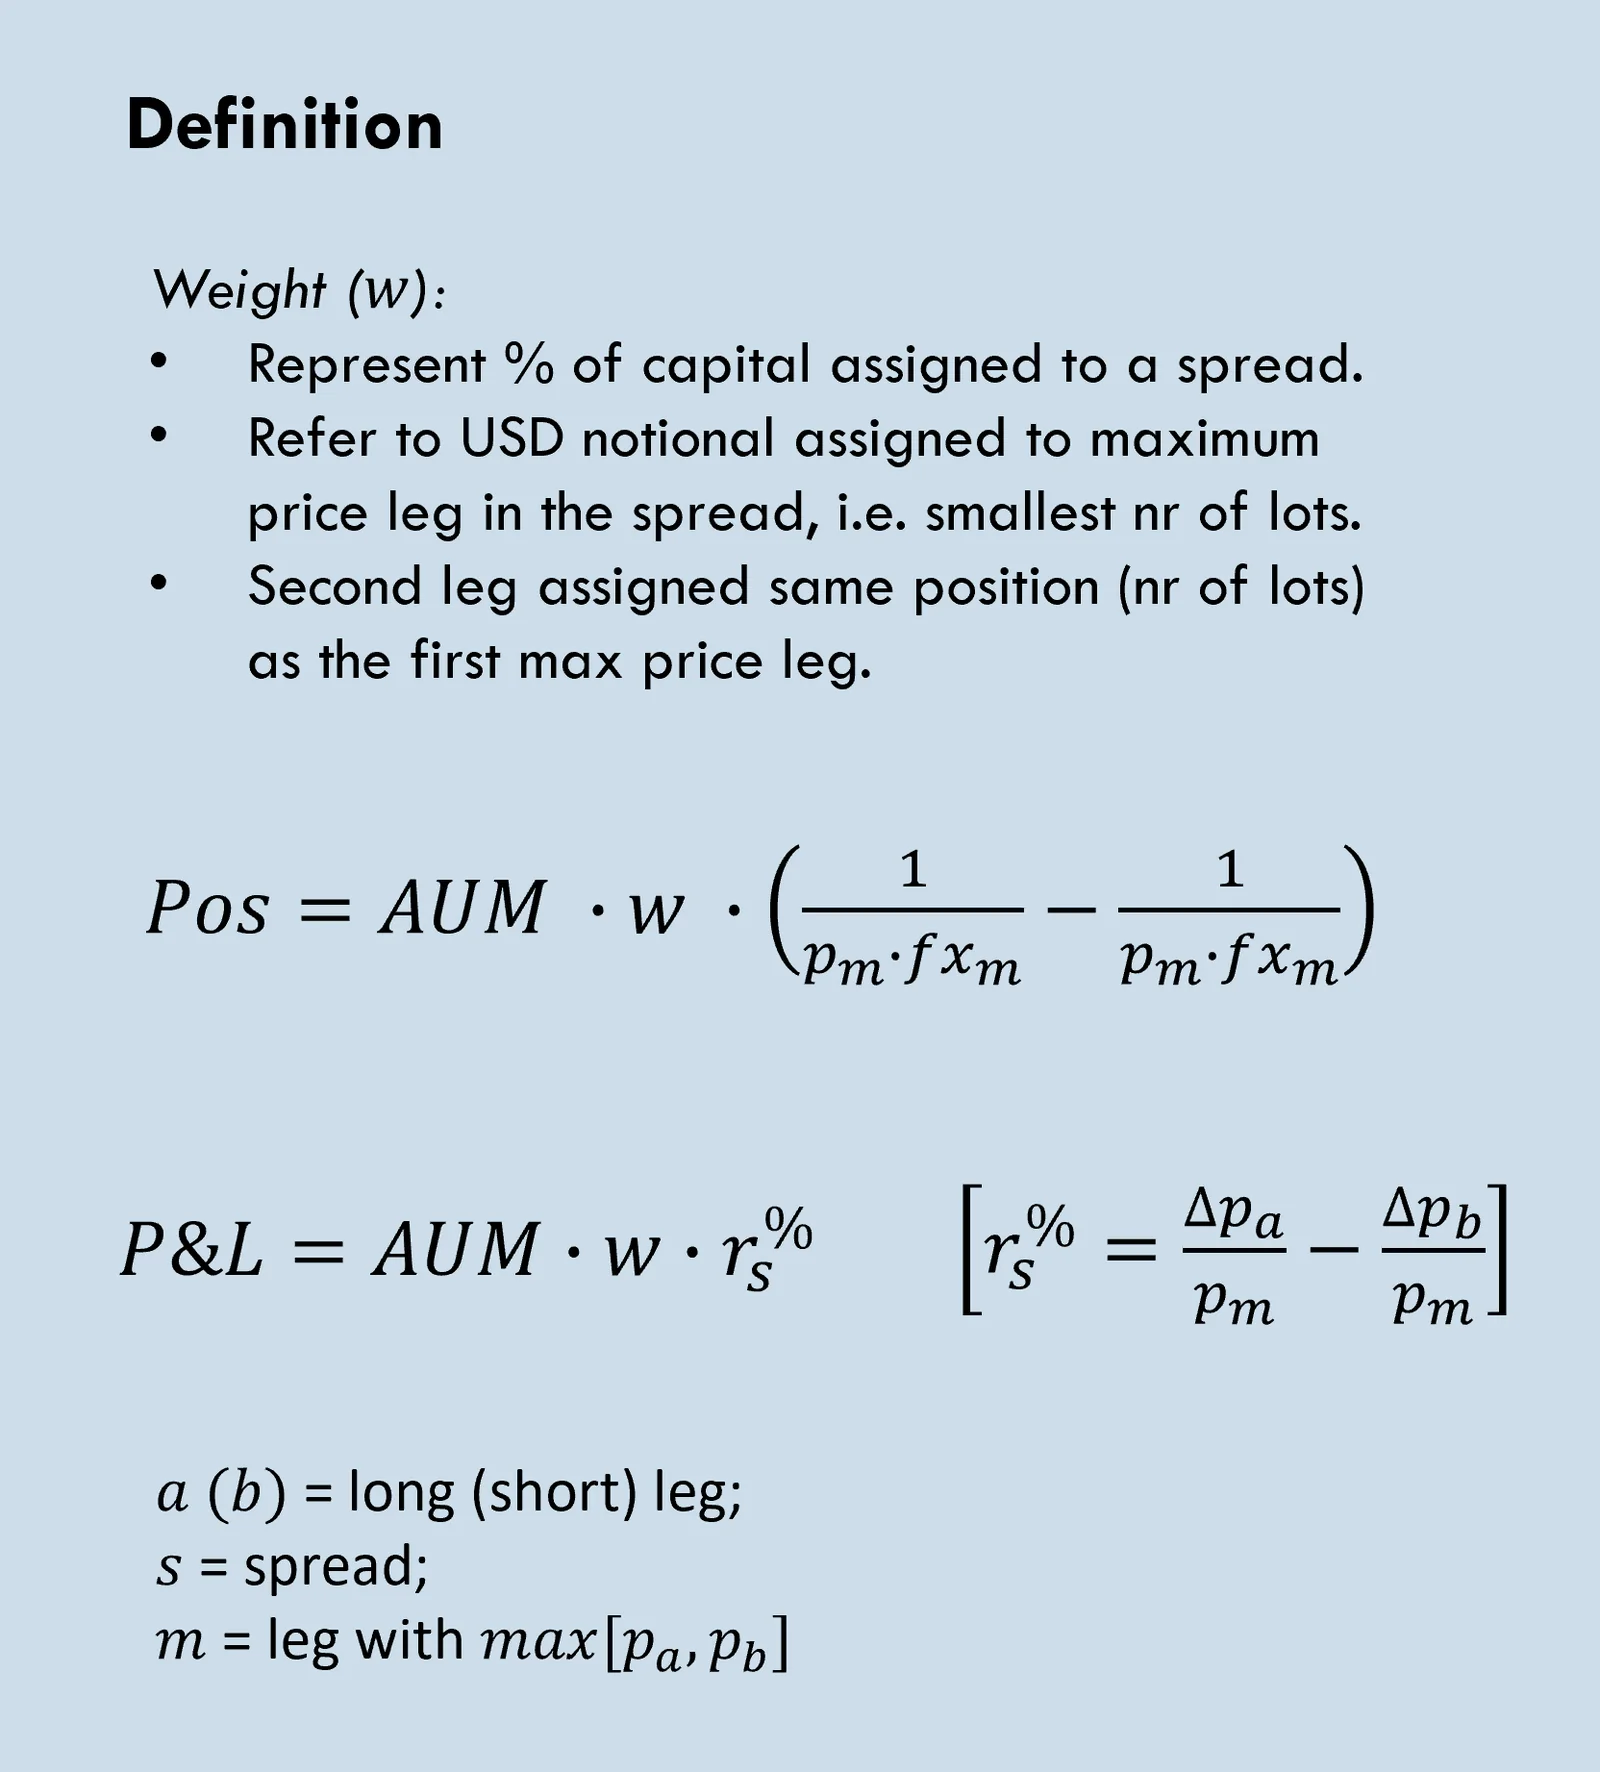
- The AiLA methodology treat spreads as a single asset, with an associated allocation weight (w).
- For an intra-commodity spread the allocation weight is used to calculate the position based on the leg with highest (USD) price.
- Both legs in the spread are then assigned the same positions in terms of number of contracts.
e.g.
WTI calendar spread M24 [82.82 $/bbl] vs Z24 [77.89 $/bbl],
with AUM = 100M and w = 1%,
would corresponds to12 lots M24 long and 12 lots Z24 short,
based on maximum price leg M24.
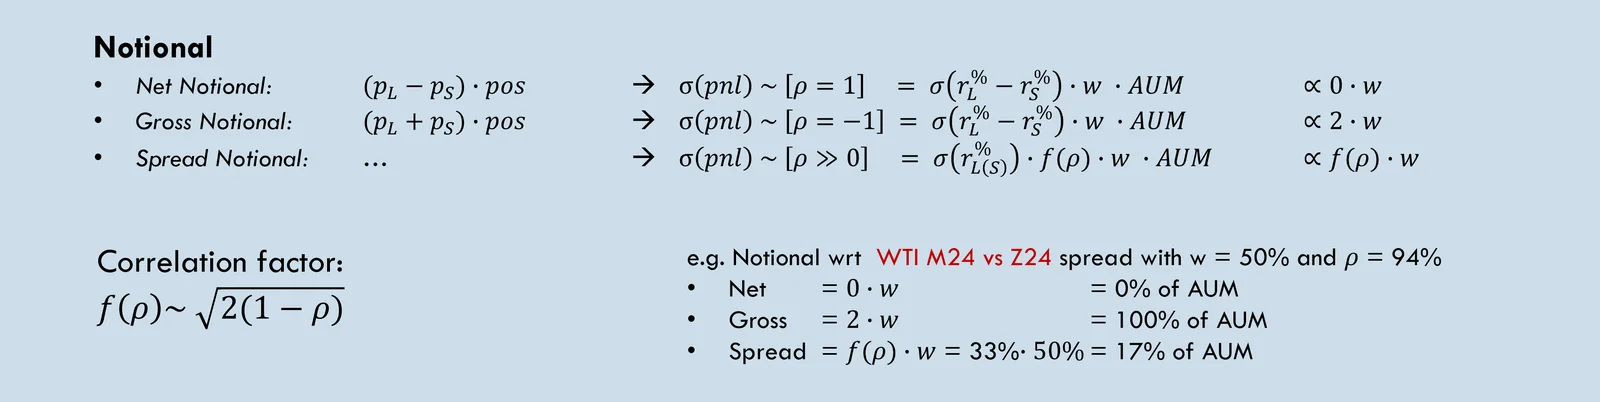
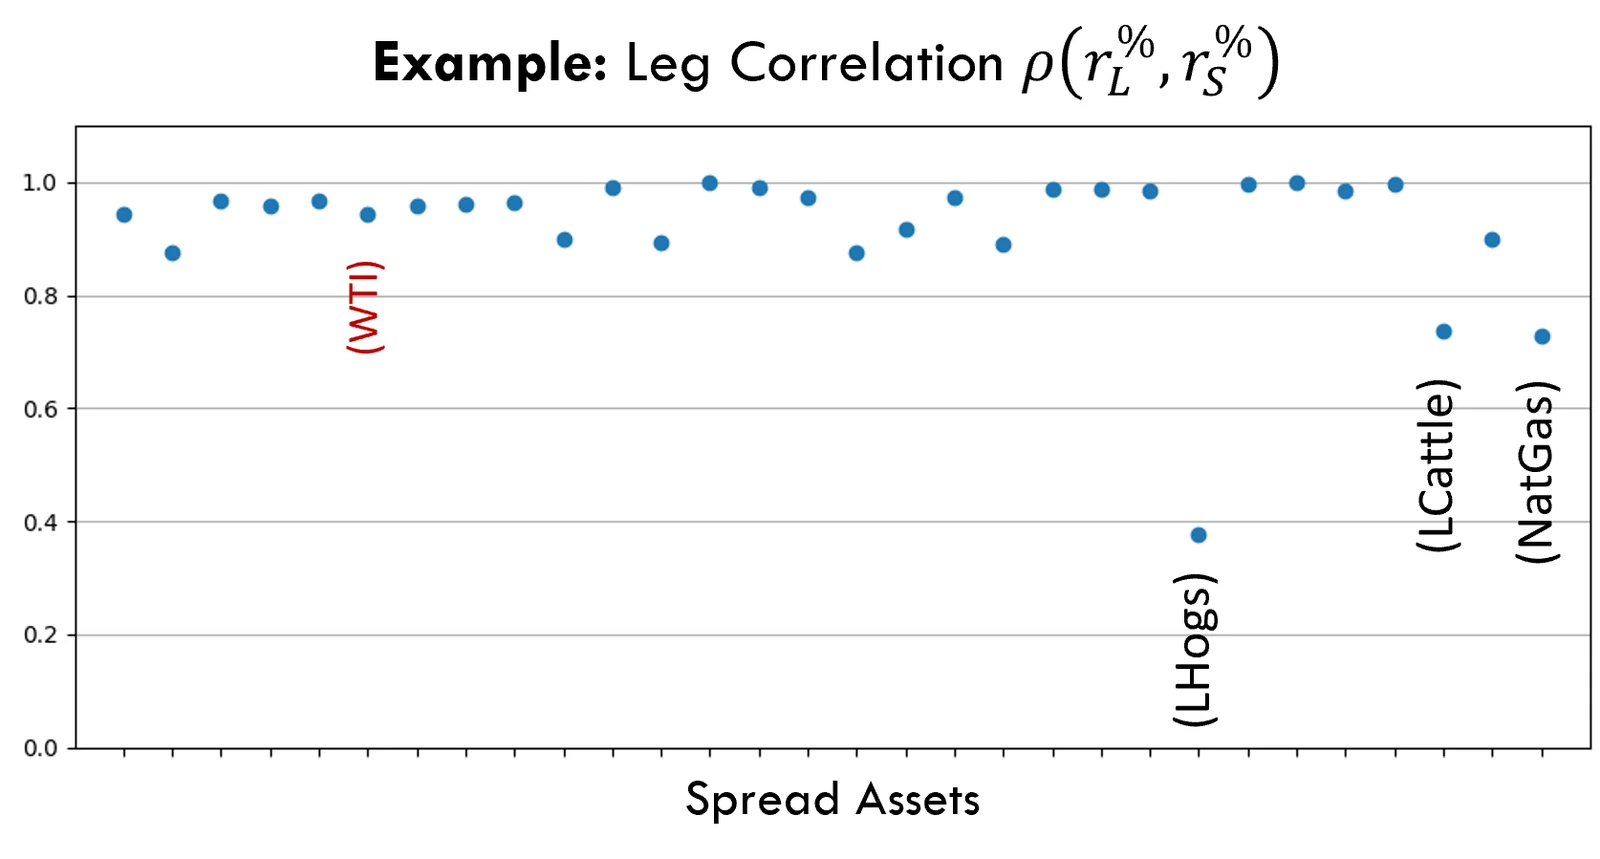
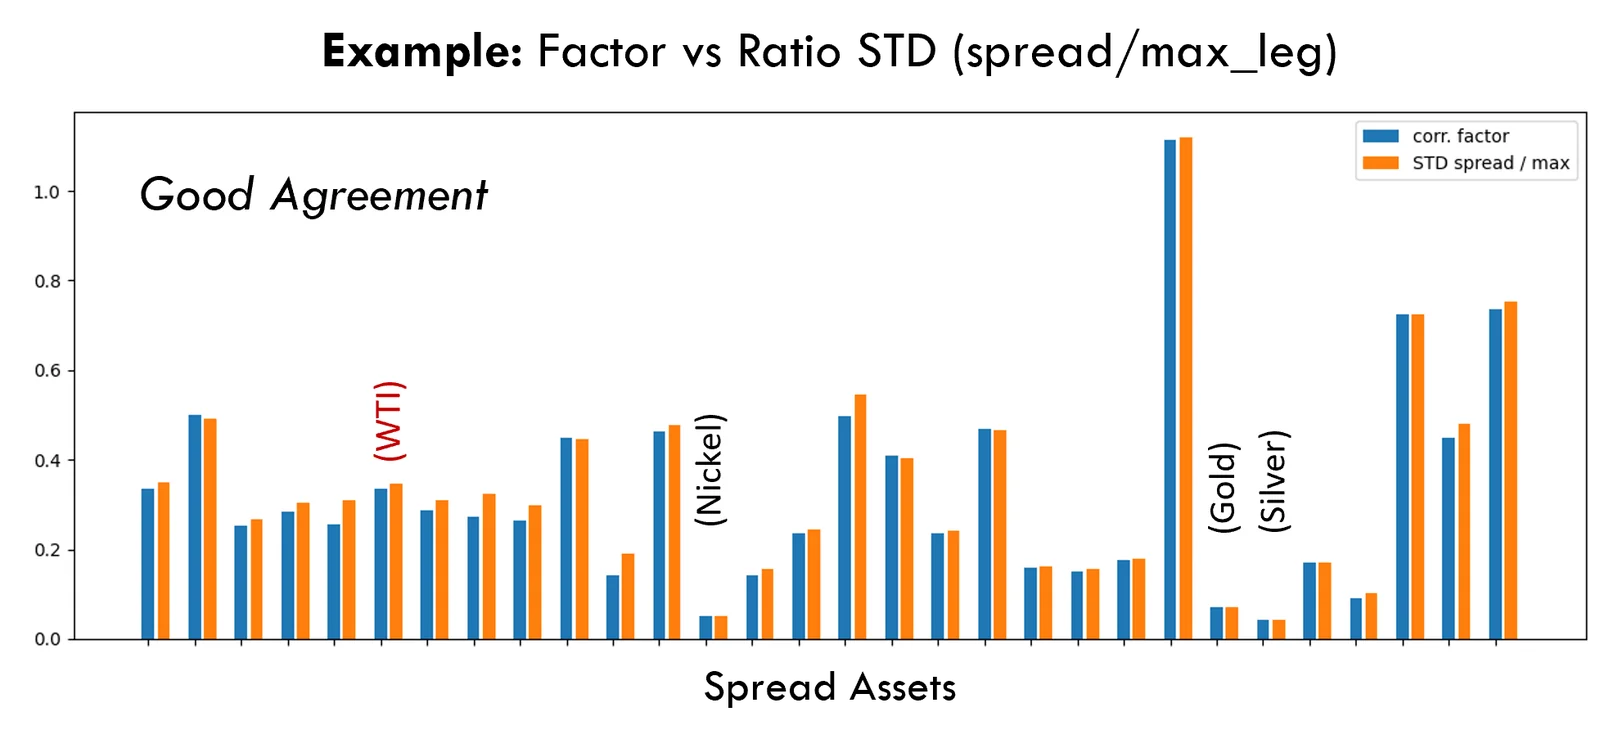
Spread Return and Notional
Portfolio
Spread Caps:
- Different position and trade constraints from outright portfolios.
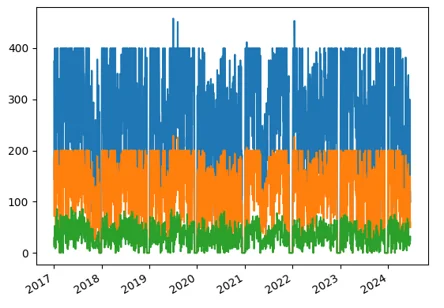
- Max sum(|w|) < 200%
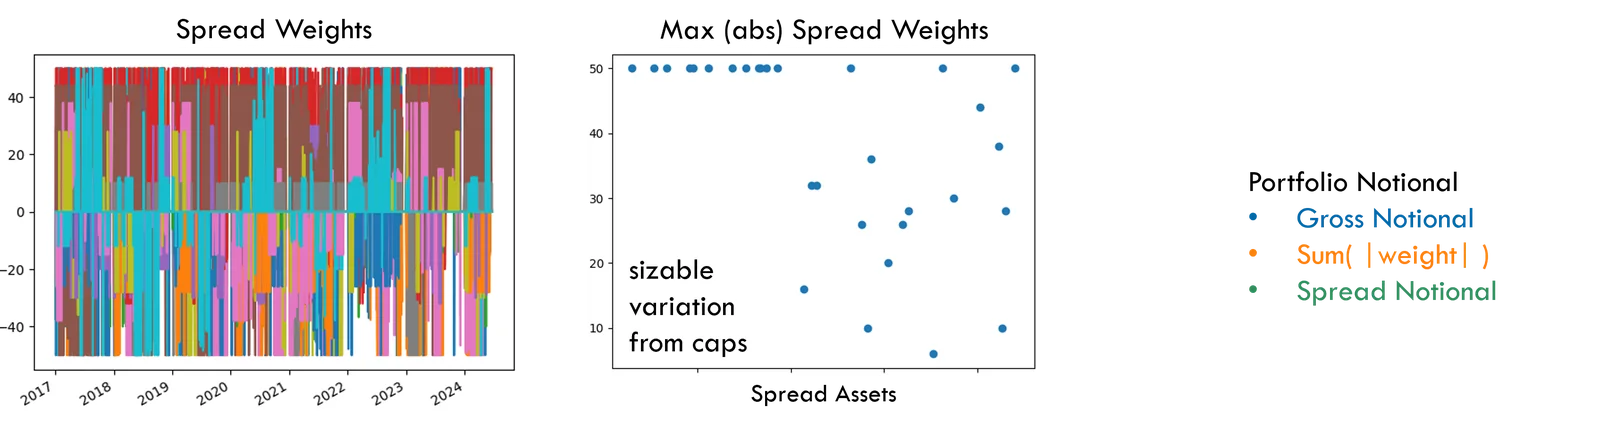
- Max spread weight < 50%
- Spread specific weight (liquidity) caps.
Typically, larger asset weights than outright portfolios to achieve reasonable risk, given smaller spread returns.
Performance
Spread Portfolio:
- Max drawdown (peak-to-trough): -4.8%
- Nr month: 62 (pos) 27 (neg) 69% (% pos)
- Return Statistics
| Statistic | Day | Week | Month | Quarter |
|---|---|---|---|---|
| Avg Return | -- | 0.2% | 0.9% | 2.7% |
| STD Return | 0.4% | 0.7% | 1.7% | 3.2% |
| Max Loss | -2.1% | -2.1% | -4.3% | -4.2% |
Outright portfolio:(similar set of commodities)
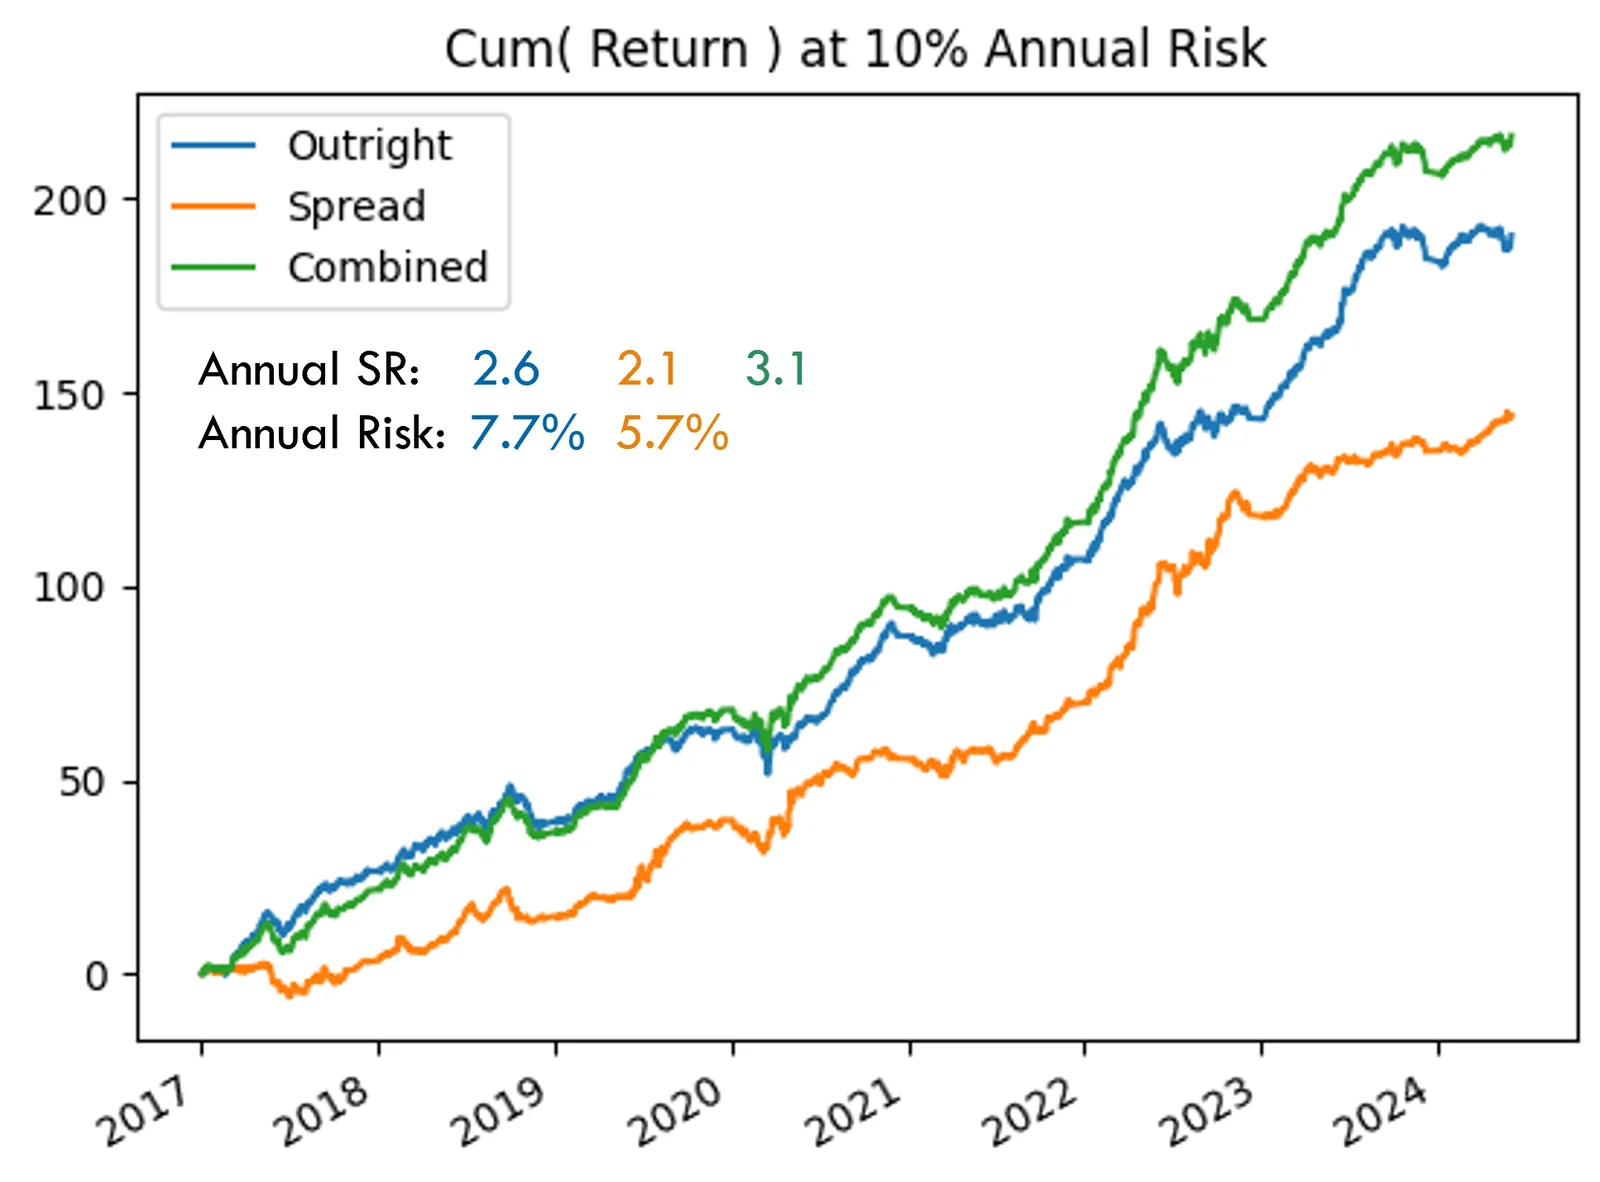
- Correlation: 23% (D), 32% (W), 36% (M), 54% (Q).
- Max diversification at about 50/50 strategy weights, when operated at their individual risk levels.
- Indicate a noticeable diversification benefit, despite slightly positive correlation.
Conclusions
- In this deck the method to include spreads in an AiLA strategy is described, and the results from a commodity spread portfolio was compared to a similar outright futures assets portfolio.
- The smaller spread returns requires an increased spread asset weight than for out right portfolios, however, a relevant portfolio risk still appears to be achievable.
- The performance of the spread portfolio is shown to be comparable to the outright portfolio over the same history, and indicate a noticeable diversification benefit, despite a slightly positive correlation.
- The current deck only address the AiLA method used for intra-commodity spreads, where other spread types will be addressed in future decks.
In average, results suggest that exit at close on T+1 is as good or slightly beneficial with respect to earlier exit options, both when exit triggered by a stoploss as well as a target.
Appendix
Portfolio Constituents
- Aluminum Month 1 vs Month 3 Spread
- Soybean July vs November Spread
- Soybeans Front November vs Deferred November Spread
- Soybean Oil July vs December Spread
- Brent June vs December Spread
- Brent Front December vs Deferred December spread
- Copper Month 1 vs Month 3 Spread
- Corn July vs December Spread
- Corn Front December vs Deferred December Spread
- Cotton July vs December Spread
- Gas Oil June vs December Spread
- Gold Month 1 vs Month 3 Spread
- Heating Oil June vs December Spread
- Arabica Coffee July vs December Spread
- Kansas Wheat July vs December Spread
- Live Cattle Month 1 vs Month 3 Spread
- Lead Month 1 vs Month 3 Spread
- Lean Hogs July vs December Spread
- Soy Meal July vs December Spread
- Natural Gas June vs December Spread
- Natural Gas Front December vs Deferred December Spread
- Nickel Month 1 vs Month 3 Spread
- RBOB March vs June Spread
- Silver Month 1 vs Month 3 Spread
- Sugar July vs October Spread
- Sugar October vs March Spread
- Wheat July vs December Spread
- WTI June vs December Spread
- WTI Front December vs Deferred December Spread
- Zinc Month 1 vs Month 3 Spread