
Machine Learning Analysis on a Diversified Market Neutral Portfolio
The Portfolio
Portfolio Composition:
- Total 149 Assets that can be aggregated into 4 sectors
- Sector breakdown:
- Ags & Livestock: 53
- Metals: 23
- Oil: 60
- Power & Gas: 13
- Each asset has two datasets (1 for Buy, 1 for Sell)
- Signal Class: Imbalanced (< 0.30) vs Balanced (>= 0.30)
- Across all sectors, most of the datasets are imbalanced.
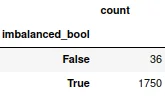
- Even across Buy vs Sell signal datasets, the signal imbalance distribution is consistent
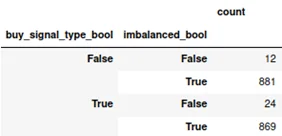
- Across all sectors, most of the datasets are imbalanced.
Analysis Approach
- For each asset dataset, we modelled 6 algorithms with hyperparameter tuning while using 0.5 as the default threshold for positive predictions.
- Model Types:
- Extreme Gradient Boosting (XGBoost)
- LightGBM (LGBM)
- CatBoost (CAT)
- Random Forests (RF)
- Extra Trees (ET)
- Decision Tree (DT)
- Metrics:
- Minimizing False Positives (FP)
- Minimizing False Negatives (FN)
- We focus on ranking each model with a weighted average
- Minimizing False Positives has a ranking weight of 2 units
- Minimizing False Negatives has a ranking weight of 1 units
- Given that each dataset has a unique distribution of binary signals, we perform the ranking across all models for each dataset using both metrics.
- For a combination of Sector-Signal type, we calculate the average weighted ranking across those datasets, and finalize the ranking of the models.
Observations on the Long Side
General Observations:
- CAT appears in the top 3 ranking for all 4 sectors
- Ags & Livestock (Rank 2)
- Metals (Rank 1)
- Oil (Rank (3)
- Power & Gas (1)
- RF and LGBM appears in the top 3 for 3 sectors
- RF:
- Ags & Livestock (Rank 1)
- Oil (Rank 2)
- Power & Gas (2)
- LGBM
- Ags & Livestock (Rank 3)
- Metals (Rank 3)
- Power & Gas (3)
- RF:
- XGB and DT tends to be more aggressive in predictions, and are better in minimizing FN. However, due to the higher weightage on minimizing FP, they have a poorer overall weighted rank.
- See detailed results in next slide
| Sector | Model | Final Rank | Weigted Average Rank |
|---|---|---|---|
| Ags & Livestock | RF | 1 | 2.9057 |
| CAT | 2 | 3.2925 | |
| LGBM | 3 | 3.5031 | |
| ET | 4 | 3.6101 | |
| XGB | 5 | 3.6258 | |
| DT | 6 | 4.0629 | |
| Metals | CAT | 1 | 3.0797 |
| ET | 2 | 3.0870 | |
| LGBM | 3 | 3.4855 | |
| XGB | 4 | 3.6377 | |
| RF | 5 | 3.6957 | |
| DT | 6 | 4.0145 | |
| Oil | ET | 1 | 3.3079 |
| RF | 2 | 3.3139 | |
| CAT | 3 | 3.3194 | |
| LGBM | 4 | 3.5667 | |
| XGB | 5 | 3.6750 | |
| DT | 6 | 3.7722 | |
| Power & Gas | CAT | 1 | 2.7949 |
| RF | 2 | 3.0513 | |
| LGBM | 3 | 3.5000 | |
| ET | 4 | 3.7692 | |
| XGB | 5 | 3.8333 | |
| DT | 6 | 4.0513 |
Long Allocations (Detailed Ranking Results)
| Sector | Model | Final Rank | Weighted Average Rank | Rank False Positive | Rank false Positive Weight | Weighted Rank False Positive | Rank False Negative | Rank False Negative Weight | Weighted Rank False Negative |
|---|---|---|---|---|---|---|---|---|---|
| Ags & Livestock | RF | 1 | 2.9057 | 1.811320755 | 2 | 3.6226 | 5.094339623 | 1 | 5.0943 |
| CAT | 2 | 3.2925 | 2.537735849 | 2 | 5.0755 | 4.801886792 | 1 | 4.8019 | |
| LGBM | 3 | 3.5031 | 3.716981132 | 2 | 7.4340 | 3.075471698 | 1 | 3.0755 | |
| ET | 4 | 3.6101 | 3.773584906 | 2 | 7.5472 | 3.283018868 | 1 | 3.2830 | |
| XGB | 5 | 3.6258 | 3.933962264 | 2 | 7.8679 | 3.009433962 | 1 | 3.0094 | |
| DT | 6 | 4.0629 | 5.226415094 | 2 | 10.4528 | 1.735849057 | 1 | 1.7358 | |
| Metals | CAT | 1 | 3.0797 | 2.652173913 | 2 | 5.3043 | 3.934782609 | 1 | 3.9348 |
| ET | 2 | 3.0870 | 2.173913043 | 2 | 4.3478 | 4.913043478 | 1 | 4.9130 | |
| LGBM | 3 | 3.4855 | 3.826086957 | 2 | 7.6522 | 2.804347826 | 1 | 2.8043 | |
| XGB | 4 | 3.6377 | 3.956521739 | 2 | 7.9130 | 3 | 1 | 3.0000 | |
| RF | 5 | 3.6957 | 3.130434783 | 2 | 6.2609 | 4.826086957 | 1 | 4.8261 | |
| DT | 6 | 4.0145 | 5.260869565 | 2 | 10.5217 | 1.52173913 | 1 | 1.5217 | |
| Oil | ET | 1 | 3.3079 | 2.491525424 | 2 | 4.9831 | 4.940677966 | 1 | 4.9407 |
| RF | 2 | 3.3139 | 2.908333333 | 2 | 5.8167 | 4.125 | 1 | 4.1250 | |
| CAT | 3 | 3.3194 | 2.916666667 | 2 | 5.8333 | 4.125 | 1 | 4.1250 | |
| LGBM | 4 | 3.5667 | 3.858333333 | 2 | 7.7167 | 2.983333333 | 1 | 2.9833 | |
| XGB | 5 | 3.6750 | 4.316666667 | 2 | 8.6333 | 2.391666667 | 1 | 2.3917 | |
| DT | 6 | 3.7722 | 4.45 | 2 | 8.9000 | 2.416666667 | 1 | 2.4167 | |
| Power & Gas | CAT | 1 | 2.7949 | 1.538461538 | 2 | 3.0769 | 5.307692308 | 1 | 5.3077 |
| RF | 2 | 3.0513 | 2.153846154 | 2 | 4.3077 | 4.846153846 | 1 | 4.8462 | |
| LGBM | 3 | 3.5000 | 3.461538462 | 2 | 6.9231 | 3.576923077 | 1 | 3.5769 | |
| ET | 4 | 3.7692 | 4.384615385 | 2 | 8.7692 | 2.538461538 | 1 | 2.5385 | |
| XGB | 5 | 3.8333 | 4.230769231 | 2 | 8.4615 | 3.038461538 | 1 | 3.0385 | |
| DT | 6 | 4.0513 | 5.230769231 | 2 | 10.4615 | 1.692307692 | 1 | 1.6923 |
Observations on the Short Side
General Observations:
- RF & CAT appears in the top 3 ranking for all 4 sectors
- RF:
- Ags & Livestock (Rank 1)
- Metals (Rank 2)
- Oil (Rank 2)
- Power & Gas (2)
- CAT
- Ags & Livestock (Rank 3)
- Metals (Rank 3)
- Oil (Rank 3)
- Power & Gas (3)
- RF:
- ET appears in the top 3 for 3 sectors. However we noted that ET has a tendency to be relatively conservative in predicting any positive signals. This lines up with our focus on minimizing False Positives, but also means that it has sparse/insufficient positive signals.
- Ags & Livestock (Rank 3)
- Metals (Rank 1)
- Oil (Rank (1)
- LGBM consistently ranks 4th (just outside of the top 3) in 3 sectors, and only had a rank 3 in Power & Gas.
- XGB and DT tends to be more aggressive in predictions, and are better in minimizing FN. However, due to the higher weightage on minimizing FP, they have a poorer overall weighted rank.
- See detailed results in next slide
| Sector | Model | Final Rank | Weigted Average Rank |
|---|---|---|---|
| Ags & Livestock | RF | 1 | 2.9937 |
| CAT | 2 | 3.1698 | |
| ET | 3 | 3.3805 | |
| LGBM | 4 | 3.5881 | |
| XGB | 5 | 3.7170 | |
| DT | 6 | 4.1509 | |
| Metals | ET | 1 | 2.6667 |
| RF | 2 | 2.9855 | |
| CAT | 3 | 3.3478 | |
| LGBM | 4 | 3.6812 | |
| XGB | 5 | 4.0000 | |
| DT | 6 | 4.3188 | |
| Oil | ET | 1 | 2.6667 |
| RF | 2 | 2.9889 | |
| CAT | 3 | 3.3611 | |
| LGBM | 4 | 3.6861 | |
| XGB | 5 | 4.0750 | |
| DT | 6 | 4.1667 | |
| Power & Gas | RF | 1 | 2.6410 |
| CAT | 2 | 3.2821 | |
| LGBM | 3 | 3.4615 | |
| XGB | 4 | 3.5641 | |
| ET | 5 | 3.9487 | |
| DT | 6 | 4.1026 |
Short Allocations (Detailed Ranking Results)
| Sector | Model | Final Rank | Weighted Average Rank | Rank False Positive | Rank False Positive Weight | Weighted Rank False Positive | Rank False Negative | Rank False Negative Weight | Weighted Rank False Negative |
|---|---|---|---|---|---|---|---|---|---|
| Ags & Livestock | RF | 1 | 2.9937 | 1.9434 | 2 | 3.8868 | 5.0943 | 1 | 5.0943 |
| CAT | 2 | 3.1698 | 2.4623 | 2 | 4.9245 | 4.5849 | 1 | 4.5849 | |
| ET | 3 | 3.3805 | 3.0472 | 2 | 6.0943 | 4.0472 | 1 | 4.0472 | |
| LGBM | 4 | 3.5881 | 3.9057 | 2 | 7.8113 | 2.9528 | 1 | 2.9528 | |
| XGB | 5 | 3.7170 | 4.1321 | 2 | 8.2642 | 2.8868 | 1 | 2.8868 | |
| DT | 6 | 4.1509 | 5.5094 | 2 | 11.0189 | 1.4340 | 1 | 1.4340 | |
| Metals | ET | 1 | 2.6667 | 1.0000 | 2 | 2.0000 | 6.0000 | 1 | 6.0000 |
| RF | 2 | 2.9855 | 2.0000 | 2 | 4.0000 | 4.9565 | 1 | 4.9565 | |
| CAT | 3 | 3.3478 | 3.1304 | 2 | 6.2609 | 3.7826 | 1 | 3.7826 | |
| LGBM | 4 | 3.6812 | 3.9130 | 2 | 7.8261 | 3.2174 | 1 | 3.2174 | |
| XGB | 5 | 4.0000 | 5.0000 | 2 | 10.0000 | 2.0000 | 1 | 2.0000 | |
| DT | 6 | 4.3188 | 5.9565 | 2 | 11.9130 | 1.0435 | 1 | 1.0435 | |
| Oil | ET | 1 | 2.6667 | 1.0000 | 2 | 2.0000 | 6.0000 | 1 | 6.0000 |
| RF | 2 | 2.9889 | 2.0000 | 2 | 4.0000 | 4.9667 | 1 | 4.9667 | |
| CAT | 3 | 3.3611 | 3.1000 | 2 | 6.2000 | 3.8833 | 1 | 3.8833 | |
| LGBM | 4 | 3.6861 | 4.1833 | 2 | 8.3667 | 2.6917 | 1 | 2.6917 | |
| XGB | 5 | 4.0750 | 5.0833 | 2 | 10.1667 | 2.0583 | 1 | 2.0583 | |
| DT | 6 | 4.1667 | 5.5500 | 2 | 11.1000 | 1.4000 | 1 | 1.4000 | |
| Power & Gas | RF | 1 | 2.6410 | 1.3077 | 2 | 2.61538 | 5.30769 | 1 | 5.3077 |
| CAT | 2 | 3.2821 | 2.3077 | 2 | 4.61538 | 5.23077 | 1 | 5.2308 | |
| LGBM | 3 | 3.4615 | 3.5385 | 2 | 7.07692 | 3.30769 | 1 | 3.3077 | |
| XGB | 4 | 3.5641 | 3.7692 | 2 | 7.53846 | 3.15385 | 1 | 3.1538 | |
| ET | 5 | 3.9487 | 4.8462 | 2 | 9.69231 | 2.15385 | 1 | 2.1538 | |
| DT | 6 | 4.1026 | 5.2308 | 2 | 10.4615 | 1.84615 | 1 | 1.8462 |
Conclusions
- We focused our ranking based on two primary metrics with a weighted ranking
- Minimizing False Positives (2 rank units)
- Minimizing False Negatives (1 rank unit)
- Based on the ranking procedure, in general, there’s no model algorithm that outperforms the others consistently.
- However, CAT, RF and LGBM tends to perform better than the others
- XGBoost and DT tends to be more aggressive in making predictions. This tends to minimizes FN, but makes it more likely to increase FP.
- ET has been observed to be too “conservative” in its nature. While it may outrank other models in terms of minimizing FP, it does not produce sufficient positive signals.