CTA Signal Modelling
Questions
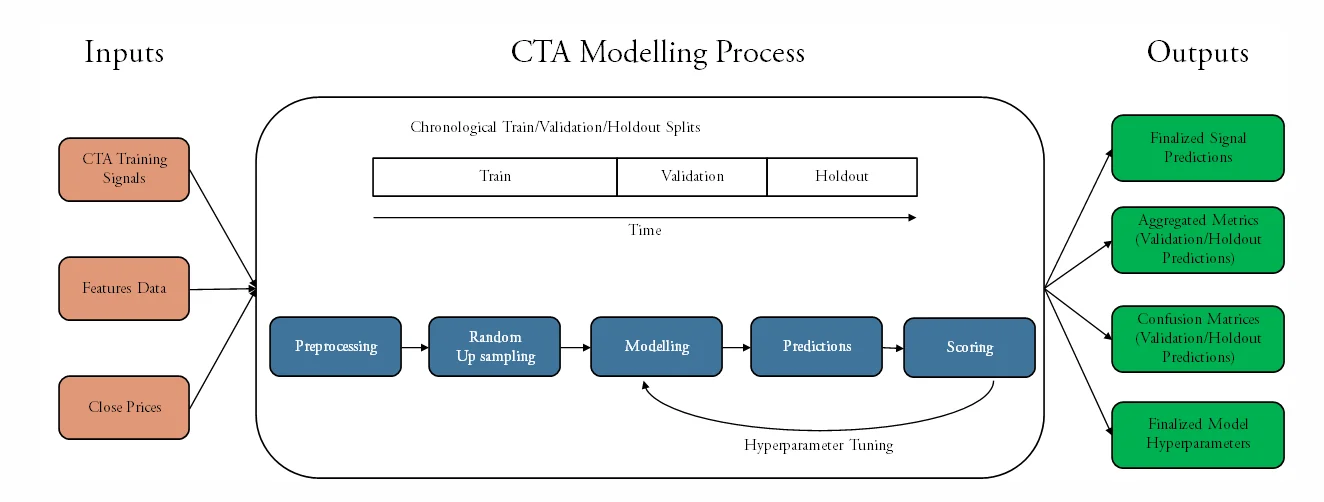
Can we create a supervised learning model for a CTA Strategy using the approaches below?
- Chronological data splitting
- To prevent data leakage and simulate proper back testing
- Random up sampling (non-synthetic)
- To handle class imbalance
- Modelling with features transformation via ensemble tree algorithms
Key Task Inputs:
- Dates
- Validation Start
- Holdout Start
- Holdout End
- Optimization Metric (Accuracy, Precision, Recall, F1, Neg Log Loss)
- Training Frequency (Year, Quarter, Month, Day)
Outputs:
- Predicted Signals for either Long or Short
- Aggregated metrics for Validation vs Holdout
- Confusion matrices for Validation vs Holdout
- Finalized model hyperparams
Chronological Data Splitting
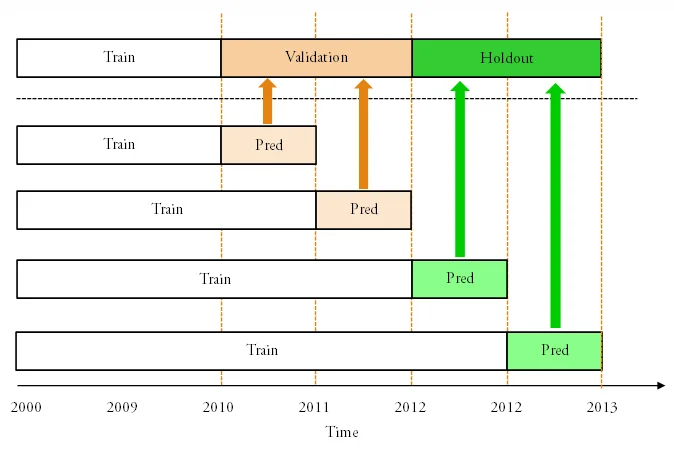
- Chronological data splitting into train/validation/holdout splits
- Assumes back testing with fixed time interval of model retraining
- Yearly
- Quarterly
- Monthly
- Daily
- Validation Period:
- Predictions during this period are scored and used for hyperparameter tuning
- Holdout Period:
- Predictions during this period are recorded but not used for any tuning
Random Up sampling (non-synthetic)
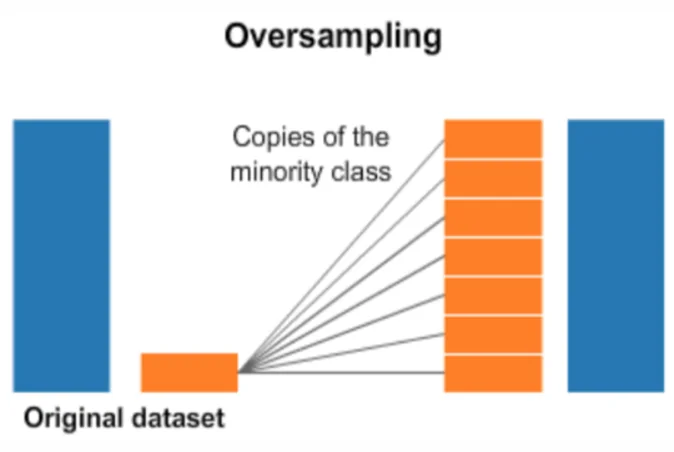
- Signal modelling is a binary classification problem
- CTA assets’ signals tend to be very imbalanced (around ratio of 1:4)
- Applying ML model directly will result in prediction of majority class most of the time
- Approach
- Non-synthetic randomized up sampling is performed of the minority class to ratio 1:1
- Up sampling implementation is done with reproducible randomized seed
Modelling Methodology
Model Framework
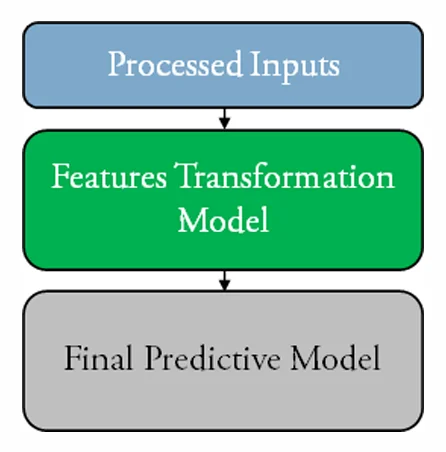
- Inputs -> Feature Transformation (FT) Ensemble Trees model -> One Hot Encoding -> Final Predictive Model
FT Ensemble Tree model:
- Utilize a supervised learning ensemble tree algorithm for feature transformation
- Approach:
- Trained on training data first (and never exposed to test data)
- Subsequently used as a feature transformation step where:
- Preprocessed data is fed into the model
- Leaves from each tree are used as input features in the next model
- Helps capture non-linearity relationship in data while acting as a form of regularization
Final Predictive Model:
- State of the art gradient boosted tree algorithm
- Takes in the one-hot encoded feature transformed data from previous layer and performs binary classification prediction
CTA Modelling Process
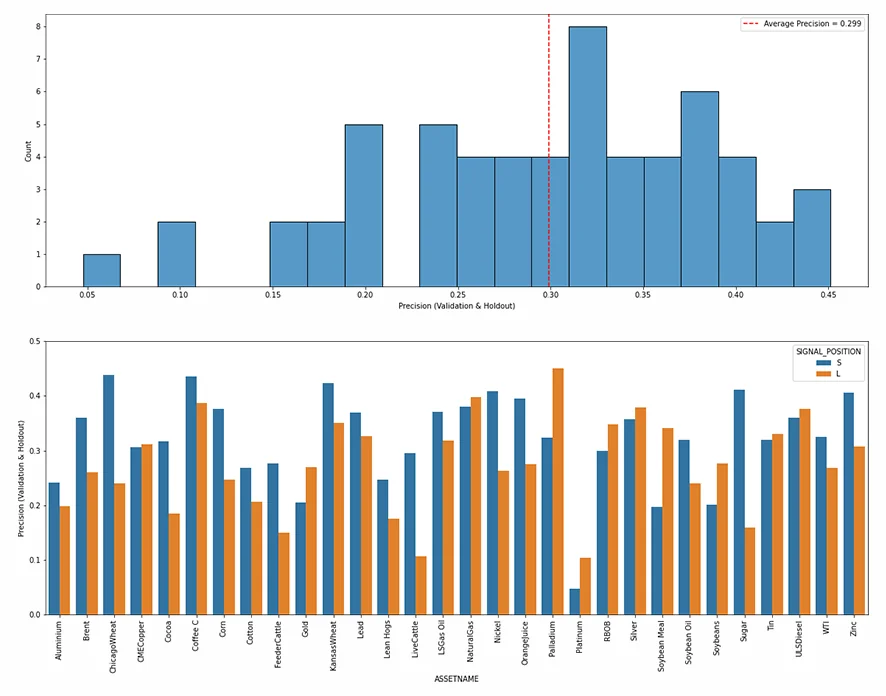
Precision Charts
Precision = (𝑻𝒓𝒖𝒆 𝑷𝒐𝒔𝒊𝒕𝒊𝒗𝒆)/(𝑷𝒓𝒆𝒅𝒊𝒄𝒕𝒆𝒅 𝑷𝒐𝒔𝒊𝒕𝒊𝒗𝒆) for combined predictions in Validation and Holdout periods for each signal position (Long/Short)
Chart 1: Histogram of Precision:
- 30 assets x 2 signal positions = 60
- Average = 0.299
- Mode is between 0.30 to 0.35
Chart 2: Precision Bar chart per Asset
- Each asset has two precision values (one for each signal position)
- Most assets have similar precision results for both signal positions