Commodity Groups with Net-Zero Exposure
Objective
Approach:
- Based on the AiLA allocation strategies, construct a portfolio with the following target properties,
- Maximum percentage of capital allocated is 100%.
- Notional long vs short exposure is zero at portfolio level, i.e. referred to as net-zero exposure.
- Net-zero exposure also to be achieved within different commodity groups of the portfolio.
- The net-zero criteria is only approximate, where a certain level of deviation from zero is acceptable.
- If necessary, not allocating to a certain commodity group is acceptable, e.g. due to the lack of AiLA allocations.
- The commodity groups are defined together with two target parameters,
- Max total allocation of the commodity group.
- Max net-zero deviation limit of the commodity group.
Questions:
- How well can the net-zero criteria be achieved?
- How does the net-zero criteria impact the portfolio performance?
- How does the commodity groups impact the portfolio performance?
Commodity Groups
- Aluminium (LME)
- Copper (CME/LME)
- Lead (LME)
- Nickel (LME)
- Zinc (LME)
Base Metals
- Gold (CME)
- Silver (CME)
Precious Metals
- Bean (CME)
- BeanOil (CME)
- Meal (CME)
- Corn (CME)
- Wheat (CME)
- Kansas Wheat (CME)
Grain
- Brent (ICE)
- GasOil (ICE)
- WTI (CME)
- HeatingOil (CME)
- RBOB (CME)
- NaturalGas (CME)
Energy
- Arabica Coffee (ICE)
- Cotton (ICE)
- NYCocoa (ICE)
- Sugar11 (ICE)
Soft
- FeederCattle (CME)
- LiveCattle (CME)
- LeanHogs (CME)
Livestock
Net-Zero Criteria
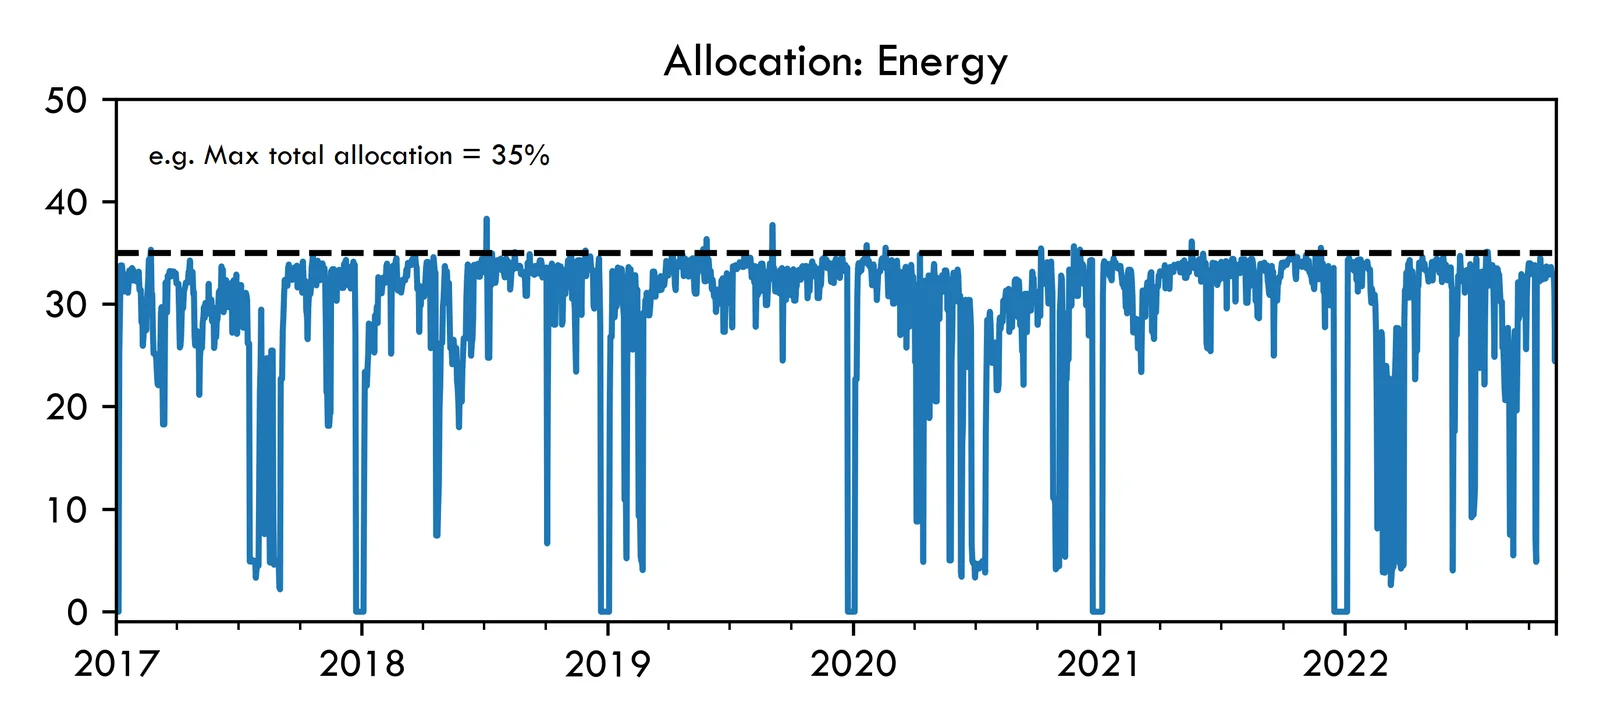
- Net-zero criteria achieved well at group and portfolio level for the default commodity groups, before the liquidity constraints are imposed.
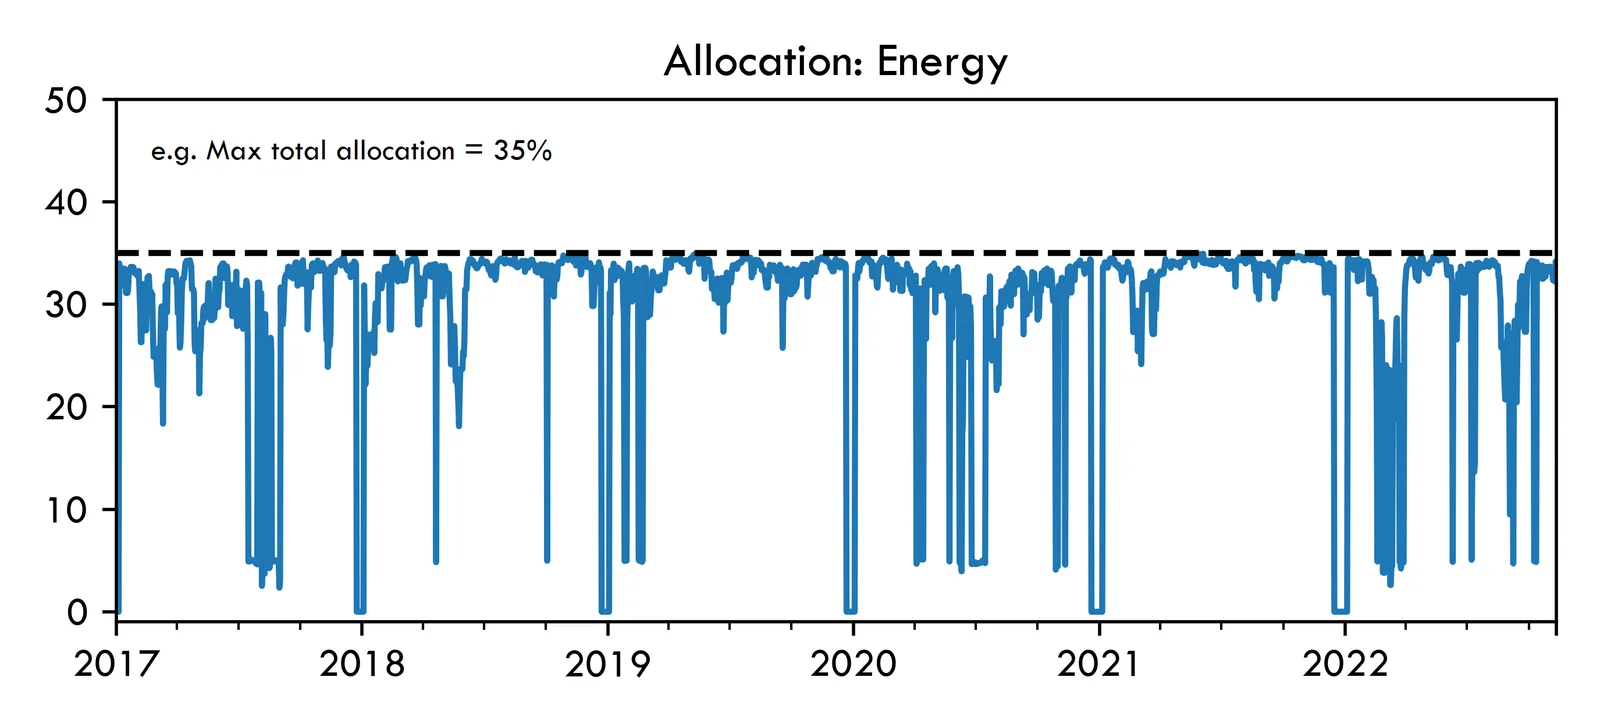
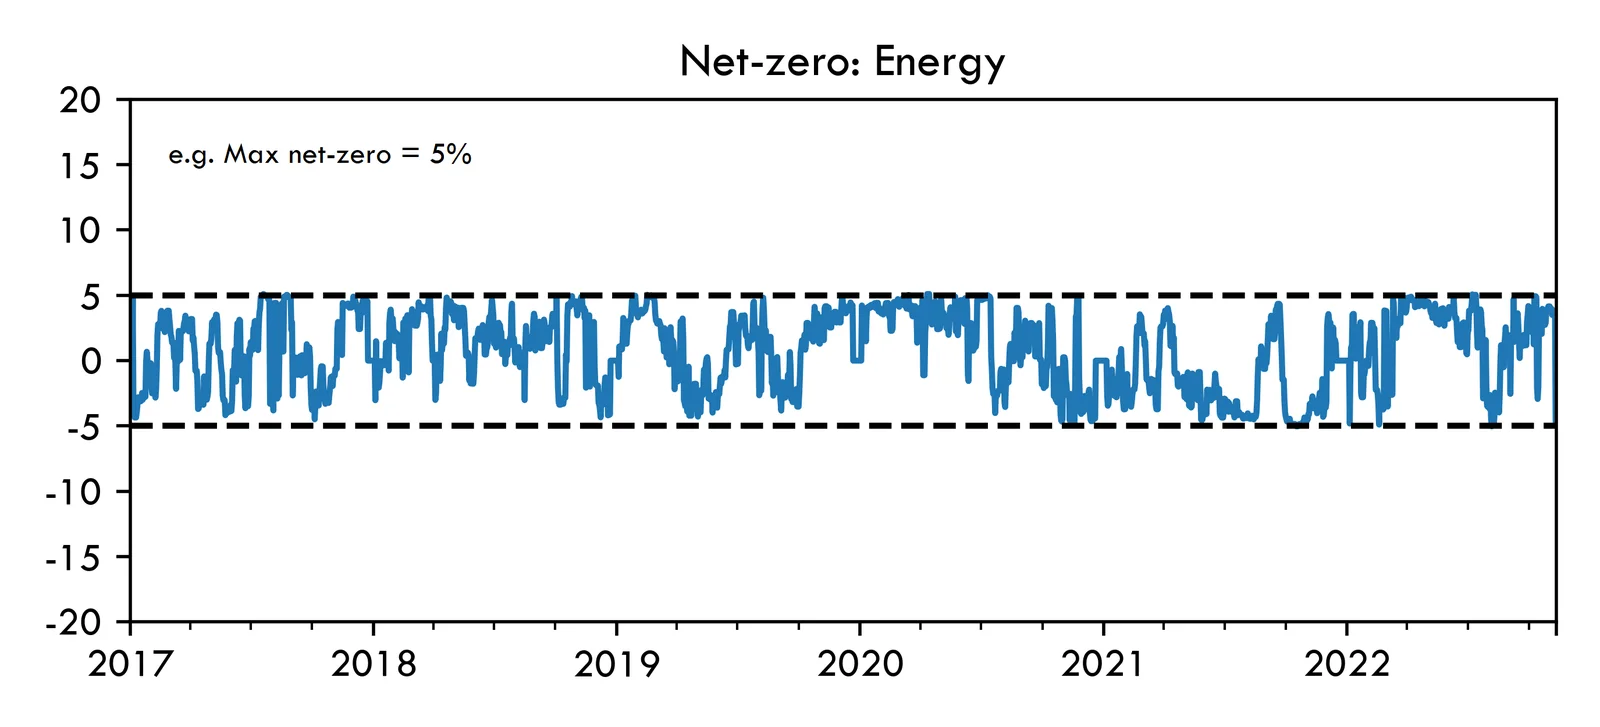
- However, criteria cannot be guaranteed on each single day when liquidity/rebalancing constraints are included (similar at portfolio level).
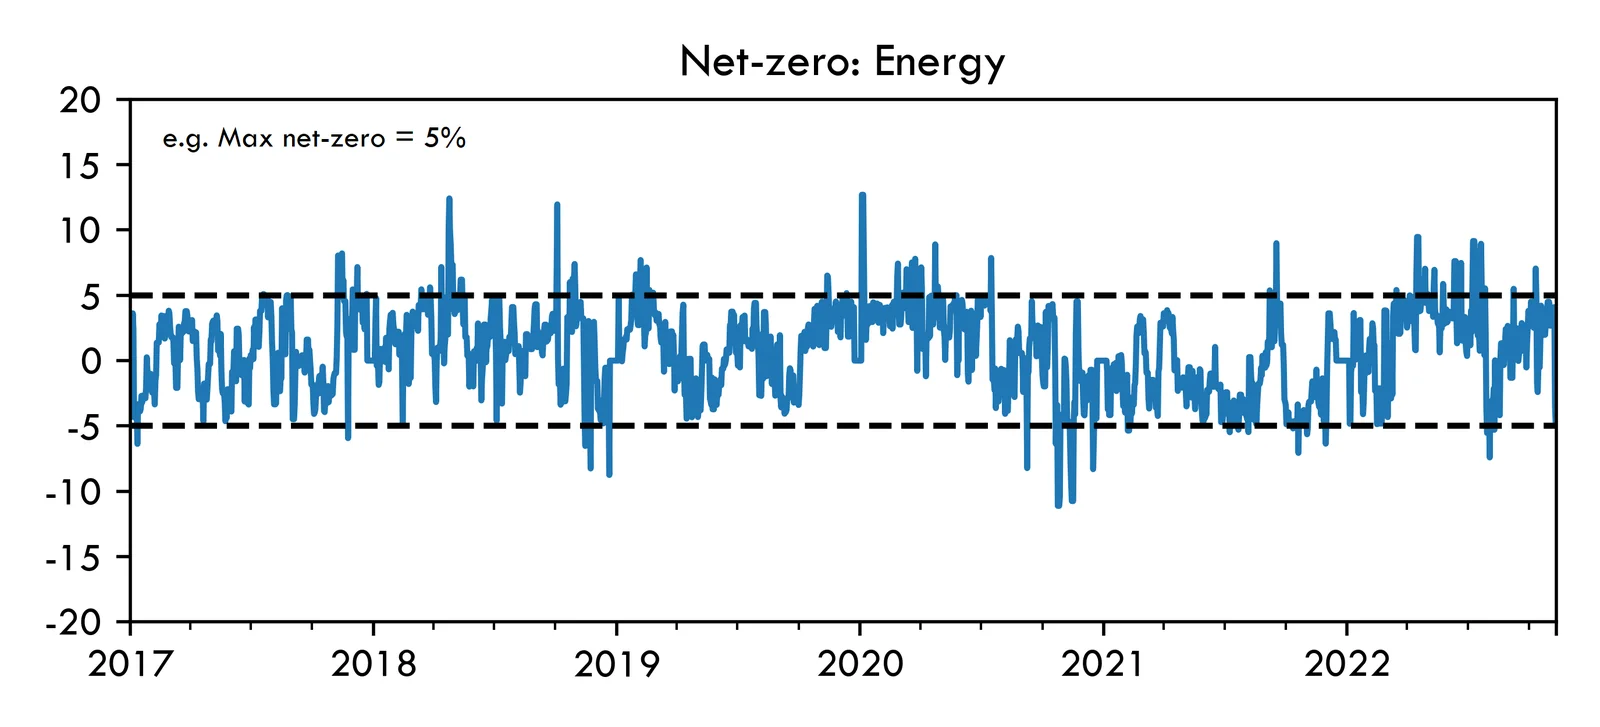
Smaller Deviation Limits
Setup
- Net-zero portfolio based on default commodity groups.
- Max total (group) allocation is unconstrained, i.e. max = 100%.
- Max net-zero (group) deviation limit same for all groups and reduced from 100% (unconstrained) to 5%.
Tendency of portfolio performance
- Reducing the limit by which the commodity groups are allowed to deviate from net-zero,
- The risk adjusted return tends to become lower,
- However, several historical drawdowns also being reduced, e.g. 2020 March.
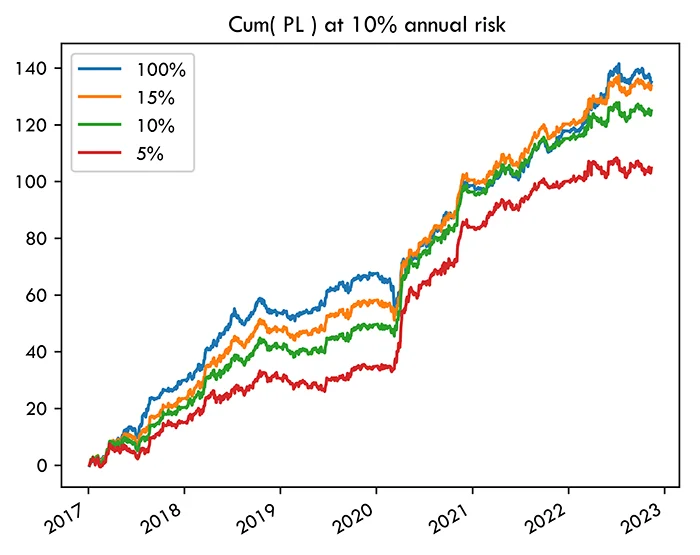
| Net-Zero | Annual SR | Annual Risk |
|---|---|---|
| 100% | 2.3 | 5.8% |
| 15% | 2.3 | 4.3% |
| 10% | 2.1 | 4.0% |
| 5% | 1.8 | 3.7% |
Smaller Groups
Setup
- Same as for reducing max net-zero deviation limit results above.
- Except, using a larger number of smaller commodity groups (S).
- Grain and Energy (default) groups are split into one group per commodity, e.g. WTI is one group.
- Grain and Energy groups chosen due to more different as well as liquid contracts, compared to other default groups.
Tendency of portfolio performance
- Introducing many/smaller groups tend to limit the occurrence of simultaneously being long and short.
- Tends to be more similar to portfolio of individual assets, i.e. no net-zero group constraints.
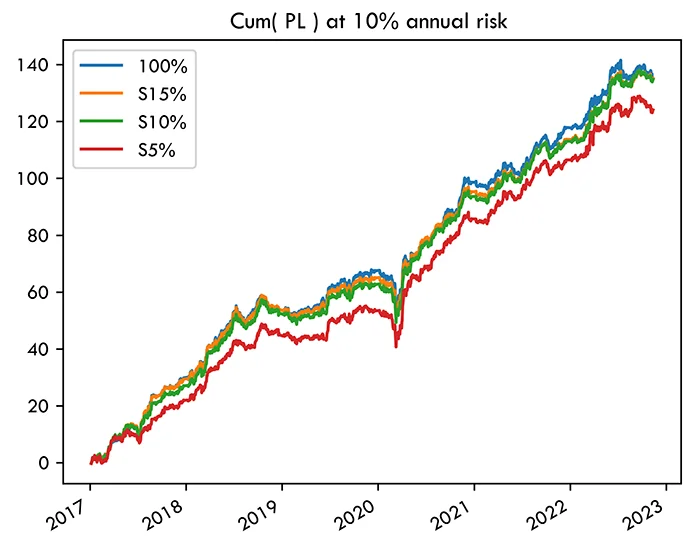
| Net-Zero | Annual SR | Annual Risk |
|---|---|---|
| 100% | 2.3 | 5.8% |
| S15% | 2.3 | 5.1% |
| S10% | 2.3 | 4.5% |
| S5% | 2.1 | 3.4% |
Summary
- An AiLA portfolio with net-zero criteria at a commodity group level appears achievable within relatively small deviations specified by the input parameters, given the set of commodities and groups investigated.
- The liquidity constraint cause some additional deviation, beyond the limits specified by the input parameters, however, to a relatively modest extent.
- The portfolio performance tends to decrease on a risk adjusted basis with a decreasing net-zero deviation limit, however, often also with historical drawdowns being reduced.
- The number/size of the commodity groups tends to be a compromise between sufficiently many assets, that can be simultaneously long and short, and similarity/correlation between the asset PnL.
Mixed Compromise Scenario?
- No max group allocation limit.
- Net-zero group limits:
- Energy: 10% (many correlated contracts)
- Others: 20% (more diverse groups).
- Slightly less historical drawdowns, while most of unconstrained performance?
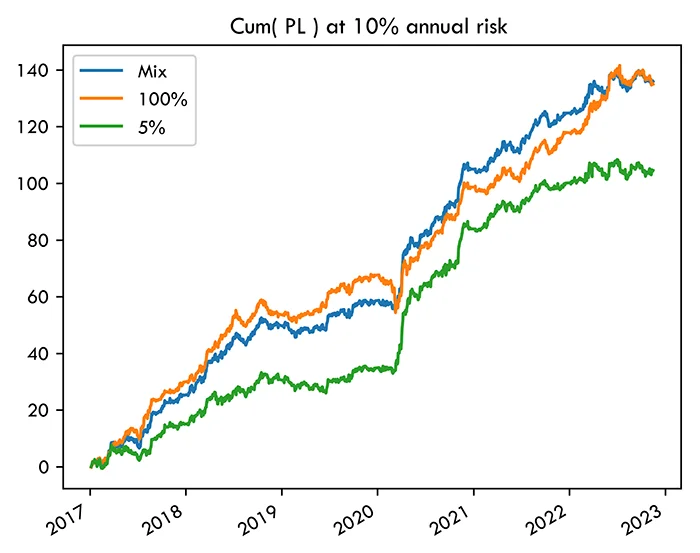
| Limit | SR | Risk |
|---|---|---|
| 100% | 2.3 | 5.8% |
| Mix | 2.3 | 4.2% |
| 5% | 1.8 | 3.7% |