
Alpha Decomposition
The Approach
Context:
The AiLA Methodology has four sources of alpha. These include:
- Allocation decision: When to be long/short/neutral based on factor based classification
- Risk optimization: How long the allocation can be at risk based on pre determined holding period and risk/reward ratio.
- Curve diversification: Which point on the forward curve should be allocated is decided by an Independent Modelling decision. An example: WTI will have 12 independent models to decide which points on the curve will be allocated
- Portfolio Construction: Steps 1,2, and 3 yield a large set of independent return streams which are then combined by using a vol targeted approach to minimize variance and correlation effects.
Approach:
- The aim was to better understand the alpha that AiLA generates by decomposing it down to the various components above
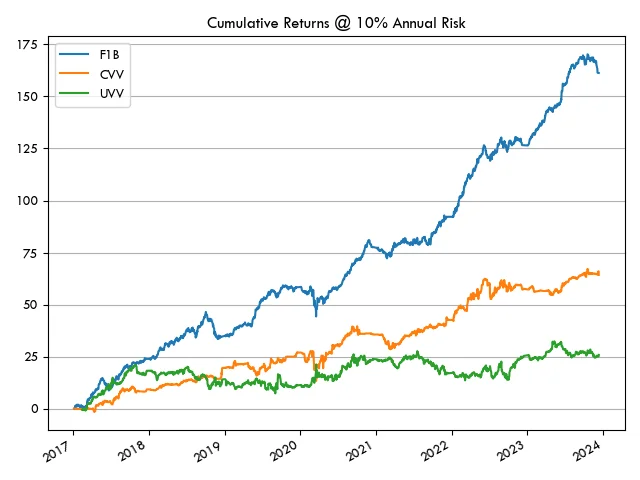
- 3 portfolios of $1B capacity were generated. Across all 3 portfolios, the Portfolio Construction, and Risk Optimization were consistent. In addition, 151 instruments across 23 diversified commodities were used:
- UVV : Unclassified Random Allocations, Risk Optimization, trading 1 point on the curve only per commodity
- CVV : Classified Allocations, Risk Optimization, trading 1 point on the curve only per commodity
- F1B : Classified Allocations, Risk Optimization, trading all points on the curve per commodity (A total of 151 instruments)
- Using the results of these portfolios, we aim to make some inferences about the components of alpha generation for AiLA
Analysis of Findings
- As expected, we observe that the performance of F1B > CVV > UVV
- The Annual Risk of CVV and UVV is low due to the low number of allocations of trading only one point on the curve for each commodity.
- By comparing CVV with UVV, the difference in sharpe of 0.6 outlines the baseline classification effect if only one point on the curve per commodity is traded.
- By comparing UVV with F1B, a difference of almost a sharpe of 2 is driven by i) Classification of allocations, ii) Independent Modelling of instruments across the curve and iii) Diversification Benefit of Portfolio Construction.
- The diversification benefit of portfolio construction is more apparent when each instrument across the curve is modelled independently and available in the portfolio to be traded
- All 3 portfolios use the same portfolio construction methodology.
- In the base UVV case, we see a low baseline of 0.4 sharpe. Portfolio construction without classification or independent instruments across the curve for each commodity does not generate much alpha
- Comparing F1B with CVV, the main difference of F1B is that it trades multiple instruments along the curve modelled independently. At a sharpe of 1, alpha generated is not substantial, even with the portfolio construction methodology. However, a substantial improvement is observed to a sharpe of 2.4 when independently modelled instruments across the curve is traded in the portfolio
| Portfolio | Sharpe | Annual Risk |
|---|---|---|
| F1B | 2.4 | 7.7% |
| CVV | 1.0 | 2.1% |
| UVV | 0.4 | 2.0% |
| Correlation | F1B | CVV | UVV |
|---|---|---|---|
| F1B | 1.000 | ||
| CVV | 0.415 | 1.000 | |
| UVV | 0.005 | 0.012 | 1.000 |
Conclusions
- As seen in the exercise, classification of allocations or portfolio construction standalone does not generate substantial alpha.
- The alpha generated by classification while appearing to be less significant standalone, provides value by virtue of bringing in a systematic approach and reliability to the process of providing inputs to the portfolio construction methodology
- The alpha generated by classification is substantially enhanced by the existence of independent return streams of trading instruments across the curve, alongside a robust portfolio construction methodology.
- While It is challenging to decompose the alpha of AiLA’s Methodology by assigning a contribution % to each component, this exercise reasonably establishes that each component of alpha generation enhances the effectiveness of each other.