
AILA’s Product Design - A Simple and Systematic Approach
AILA’s Systematic Approach to Design
Public Data & Open Source Models BUT Interpretation of Risk and Returns with a commodity lens
QUANTITATIVE METHODS
- Treat every futures expiry on an asset separately within the same curve. This gives different returns within the same commodity market. Example: WTI Jun and WTI Dec have separate return streams thus over all WTI returns from 12 months on the curve yields low volatility in returns
- Embed risk parameters within the performance such that if returns are negative then exit and re-allocate when opportunities arise. This results in opportunistic allocation instead of constantly allocated
- Avoid forecasting of prices. Instead focus on timing of allocation which includes when to allocate and exit risk.

FUNDAMENTAL BACKGROUND
- Focus on commodities where team has a strong background from fundamental trading perspective
- Use data which are publicly available but transform into meaningful factors. Example: Use the distance between first notice date and expiry date of the contract to asses liquidity drops
- Focus on term structure of the asset as an information highway. Example why is March/April RBOB or July/Nov Beans more important than other spread months in RBOB and Soybeans
- Respect the behaviour of assets across different months to extract seasonality and the drivers for seasonality

DOWNSTREAM PORTFOLIO DESIGN WITH FOCUS ON RISK MANAGEMENT 35%
MODELING AND QUANTITATIVE METHODS 15%
UPSTREAM DESIGN FUNDAMENTAL BACKGROUND 45%
DATA 5%
Relative Importance of building blocks
BACKGROUND
Amplification of Small Edge Opportunities
Ambition
- Like many systematic investment strategies,
- Small individual profit/loss edge opportunities,
- Being amplified to relevant long-term profits,
- By independently repeated many times.
Application
- Predict small edge commodity opportunities,
- Repeated across many individual commodity markets as well as futures contracts.
- Independent repetitions also from short holding periods, however, balanced w.r.t. transaction costs.
For example
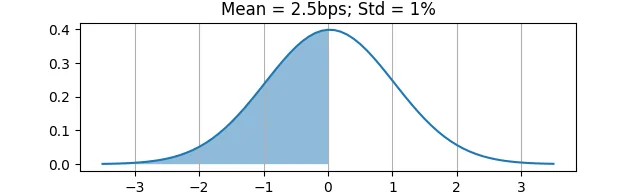
- Return distribution for an individual asset and a single day has tiny PnL edge (2.5 bps) compared to the typical return size (1%).
- Given 100 daily returns typically 51 are positive and 49 are negative.
- However, same opportunity repeated every day across 25 independent assets result in a Sharpe ratio ~ 2, i.e. 20% annual return at 10% risk.
SMALL EDGE OPPORTUNITIES
AILA’s Approach to Data Features
Ambition
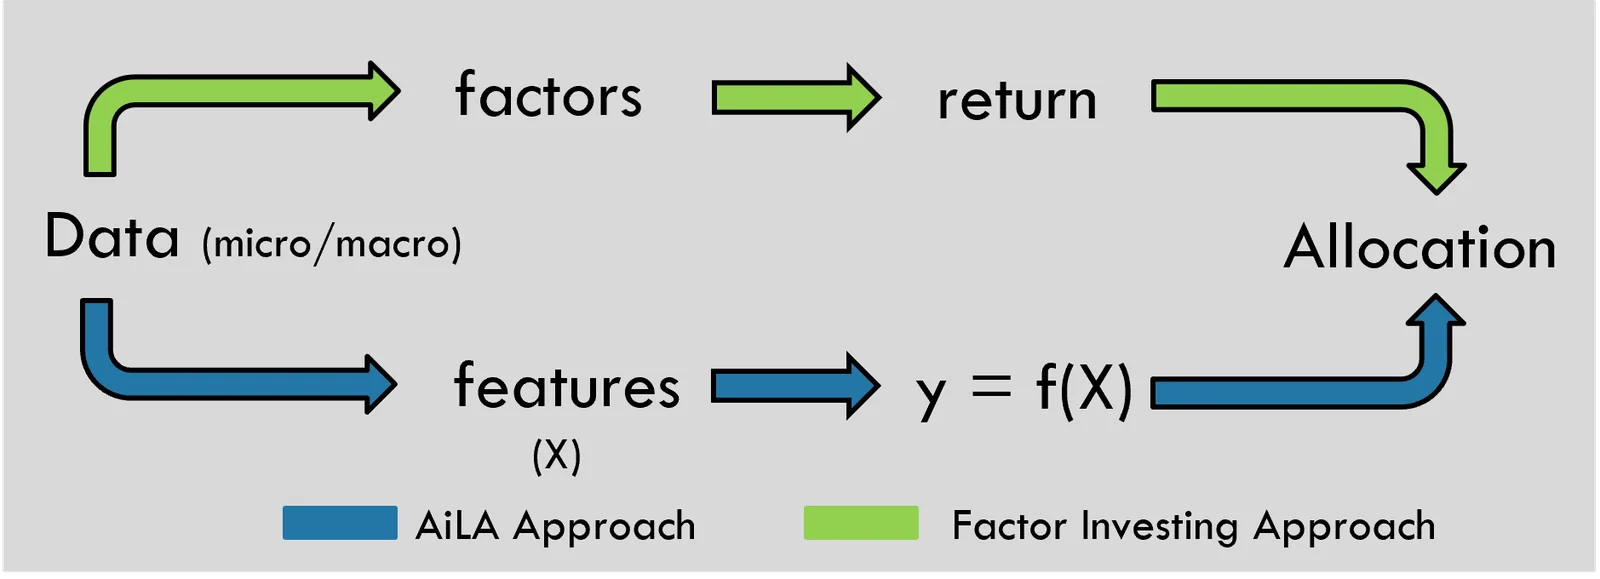
- Commodity returns expected to be driven by different micro as well as macro factors.
- Factors partly represented in market as well as fundamental data.
- Try to identify dominant factors in order to motivate allocation opportunities.
Application
- Construct data features as proxy for price factors.
- Train model to predict allocation opportunities, i.e. favorable risk/reward forecast associated with characteristic factor signature in features data.
- Price typically impacted by multiple factors and “noise” yielding only small PnL edge opportunities.
For example
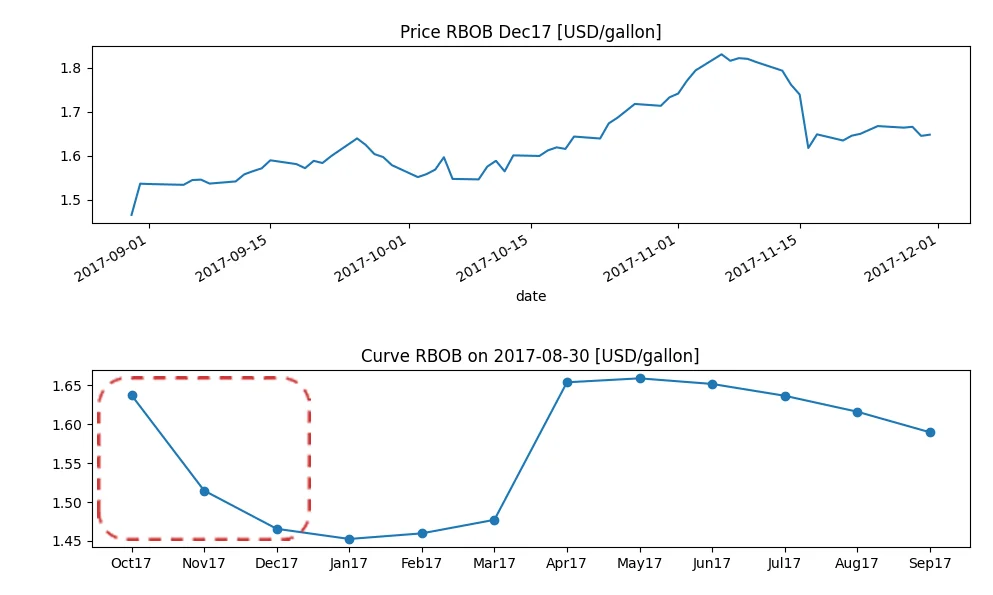
- During Sep and Oct in 2017 the RBOB price was partly impacted by a supply (micro) factor.
- The refinery disruption by hurricane Harvey was anticipated to decrease short-term supply.
- The tighter supply was reflected in the front contract spreads, i.e. part of micro features.
UN-CORRELATED COMBINATIONS
Combination of Un-Correlated Opportunities
Ambition
- Equivalent opportunities should contribute equally to the portfolio return.
- Dependent opportunities should not result in duplicated allocations to “same” opportunity.
- Better opportunities should contribute more to portfolio return, but difficult to estimate.
Application
- Equalize allocations w.r.t. risk, i.e., prevent concentration of risk to more volatile assets.
- Consider allocations together with market return correlation, i.e., prevent concentration of risk to similar positions in highly correlated assets, such as same commodity contracts.
- Typically treat individual opportunity predictions as equivalent.
For example
- Many independent opportunities result in higher risk adjusted portfolio returns.
- However, increased market correlation result in lower number of independent opportunities, for a given number of actual assets allocations, as well as increased portfolio volatility.
- Micro factors typically more important than macro for individual allocation decisions.
- Therefore, strategy expected to perform better during periods dominated by idiosyncratic micro factors, rather than common macro factors, such as interest rates or the USD.